This week’s two-pronged Chart of the Week may offer more food for debate and thought than it does clear answers. Given the number of variables that affect the U.S. economy, and the fact that today’s economy is a vastly different animal than that of the 1970s, 1980s or even 1990s (given the changes wrought by technology and globalization), the data may prove an interesting jumping off point for prognosticators interested in discussing what happens next, especially in light of the U.S. jobs market report for October, scheduled for release at the end of this week. It may end up proving to be the case, as Reuters BreakingViews suggested in this analysis, that these data points shape the election’s outcome, rather than any views of the lessons of history.
Tuesday, October 30, 2012
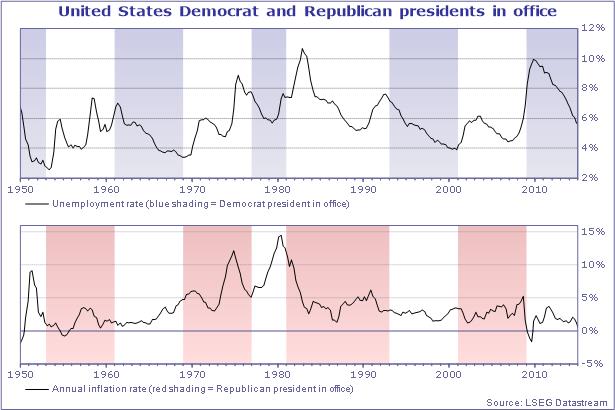
From Datastream:
This week’s two-pronged Chart of the Week may offer more food for debate and thought than it does clear answers. Given the number of variables that affect the U.S. economy, and the fact that today’s economy is a vastly different animal than that of the 1970s, 1980s or even 1990s (given the changes wrought by technology and globalization), the data may prove an interesting jumping off point for prognosticators interested in discussing what happens next, especially in light of the U.S. jobs market report for October, scheduled for release at the end of this week. It may end up proving to be the case, as Reuters BreakingViews suggested in this analysis, that these data points shape the election’s outcome, rather than any views of the lessons of history.
This week’s two-pronged Chart of the Week may offer more food for debate and thought than it does clear answers. Given the number of variables that affect the U.S. economy, and the fact that today’s economy is a vastly different animal than that of the 1970s, 1980s or even 1990s (given the changes wrought by technology and globalization), the data may prove an interesting jumping off point for prognosticators interested in discussing what happens next, especially in light of the U.S. jobs market report for October, scheduled for release at the end of this week. It may end up proving to be the case, as Reuters BreakingViews suggested in this analysis, that these data points shape the election’s outcome, rather than any views of the lessons of history.
Subscribe to:
Post Comments (Atom)
I"m Brian Hoshowski on my way to a dual significant in Mathematical and Business economics but experience like having some development information will provide me an advantage when i graduate student. I do have a qualifications in Visible C, having done a season in Technological innovation but i wonder if its even a relevent terminology these days.
ReplyDeleteWhich terminology is the best for economical programs such as finance economics research and average information crunching?
Thanks!